
|
|
|
|
|

|
|
|
|
|
The census originated in Roman times when citizens and their property were enumerated. Nowadays, the data collected in a national census is analyzed statistically and published for the benefit of the governments, corporations and private citizens of Canada. Probably the largest users of census data are the Federal and Provincial governments. They use the data to plan for education and health care, forecast taxes and so on. Taking a census at regular intervals allows the governments to see changes and trends and makes their forecasting much more accurate. The first census in Canada was conducted in 1666 by Jean Talon in the "Colony of New France". It recorded the age, sex, marital status and occupation of th 3215 inhabitants. In 1667, more details of the livestock and property were taken, showing 3915 hectares of land under cultivation with 3107 cattle and 85 sheep. Since confederation the British North America Act provided for the federal government to take a census every 10 years beginning in 1871. At the turn of the century, the rapid expansion of Western Canada created a demand for agriculture information at more frequent intervals. A separate census of Agriculture was conducted every five years beginning in Manitoba in 1896, the combined territory of Saskatchewan and Alberta in 1906 and expanded to the rest of Canada in 1951. This census is conducted simultaneously with the population census also beginning in 1951. The latest Agriculture Census was taken in 1996. The following is abstracted from Statistics Canada summary reports. The total capital value of Saskatchewan's farms was calculated as $29,833,477,289 in 1996 with an average value $523,587. From 1991 to 1995 gross farm receipts increased 21% to $5,623,801,500 or an average of $98,700 per farm. This increase was offset by 15.2 % higher operating expenses compared to 1991 of $4,356,627,913 or $76,460 per farm. Over the same time period outstanding farm debt decreased 13% to 4,509,308,000.
The number of farms are decreasing nationally, but they're getting bigger. While overall numbers of farms have been declining, the size of farms in terms of gross sales has been increasing. Nationally between 1991 and 1996, the number of farms with gross receipts of $100,000 or more (constant 1995 dollars) increased 10.9% to 83,090. These larger farms increased in number in all provinces except Newfoundland and New Brunswick. Saskatchewan had the highest percentage increase at 30.6%, to 18,801 out of a total of 56,995 farms. |
|
|
|
Land & Crops
Wheat is still Canada's largest crop. However, even with more than 30.7 million acres in 1996, it commanded a substantially smaller proportion of total field crop area than at any time in the past 20 years. In 1996, 35.8% of all field crop area was seeded to all types of wheat, including winter wheat, down from 42.6% in 1991 and 43.2% in 1986. The decline in wheat acreage was primarily the result of farmers diversifying into other crops.
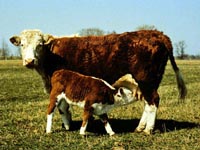
Beef cow numbers rose in every province between 1991 and 1996; for a Canadian total of 4.7 million. The West experienced higher growth (+23.4%) than the East (+16.3%) over the period 1991-1996. Western Canada accounted for 84.1% of the national total, an increase from 82.7% in 1986. There were just over 1.2 million dairy cows, a 6.6% decline since 1991. There was an even larger decline in the number of farms with dairy cows. Those farms declined 20.9% to 30,926. The net result was an increase in the average herd size, from 34 cows per farm in 1991 to 40 in 1996. Although dairy cow numbers have been steadily declining, milk production has remained fairly constant. Increased production per dairy cow has been achieved through improved breeding, feeding and milking techniques, including an increase to three milkings per day from the traditional two by some operations. While dairy cow numbers declined in both Ontario (-8.6%) and Quebec (-8.3%), the two provinces still dominated the dairy industry with 71.4% of all dairy cows. Quebec led the nation with 471,855 dairy cows, 38.4% of the total. The number of hogs in Canada increased 8.1% to a near record 11.0 million, as farmers responded to strong export markets for both live hogs and pork products. Although the number of hogs increased in both the East and West, growth in Western Canada was slightly higher at 9.6%, compared to 7.1% in Eastern Canada. Consequently, Western Canada's share of hogs increased to 40.2% of the national total, a strong gain from 34.3% in 1986. There were 102.3 million hens and chickens in Canada in 1996, up 7.8% from the 1991 Census. About two-thirds of them were in Eastern Canada. As was the case for beef cows and pigs, the national flock of hens and chickens grew faster in the West. Between 1991 and 1996, the flock in Western Canada increased 10.5%, compared to 6.5% in Eastern Canada.
|


|
|
|